Network Simulator (Version 2), widely known as NS2, is simply an event-driven simulation tool that has proved useful in studying the dynamic nature of communication networks. Simulation of wired as well as wireless network functions and protocols (e.g., routing algorithms, TCP, UDP) can be done using NS2. In general, NS2 provides users with a way of specifying such network protocols and simulating their corresponding behaviors. Since its inception in 1989, NS2 has continuously gained tremendous interest from industry, academia, and government. Having been under constant investigation enhancement and for years, NS2 now contains modules for numerous network components such as routing, transport layer protocol, application, etc. To investigate network performance, researchers can simply use an easy-to-use scripting language to configure a network and observe results generated by NS2. Undoubtedly, NS2 has become the most widely used open source network simulator, and one of the most widely used network simulators. Unfortunately, most research needs simulation modules which are beyond the scope of the built-in NS2 modules. Incorporating these modules into NS2 requires a profound understanding of NS2 architecture.
Architecture of NS2
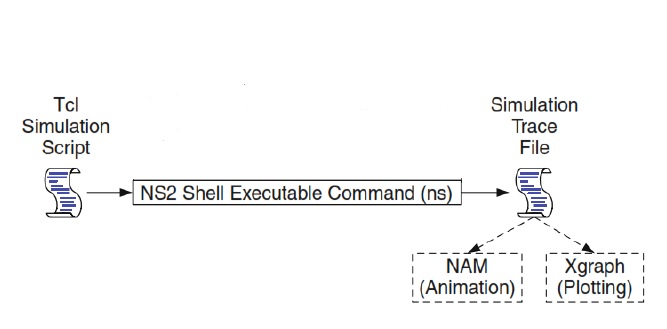
As shown in fig 1. NS2 architecture consists of Tcl, NS2 Shell Executable Command, NAM and Xgraph

TCL
Tcl (originally from Tool Command Language, but conventionally spelled “Tcl” rather than “TCL”, pronounced as “tickle” or “tee-see-ell”) is a scripting language created by John Ousterhout. Originally “born out of frustration”, according to the author, with programmers devising their own languages intended to be embedded into applications, Tcl gained acceptance on its own. It is commonly used for rapid prototyping, scripted applications, GUIs and testing.
Tcl is used on embedded systems platforms, both in its full form and in several other small-footprint versions. The combination of Tcl and the Tk GUI toolkit is referred to as Tcl/Tk.
NS2 shell executable command
We run Tcl script files in command prompt in NS2. The procedure is as follows. To Run TCL files in NS2
- Install NS2 and set the path.
- After Installing NS2, go the $prompt and run ns filename for example, ns tcp.tcl (if the file name is tcp.tcl
- After the previous statement automatically the .nam and .tr files will be created in the same (Nam means Network Animator and tr means Trace file).
- To see the demo in GUI, run nam tcp.nam (a window will be opened and you can click the run button)
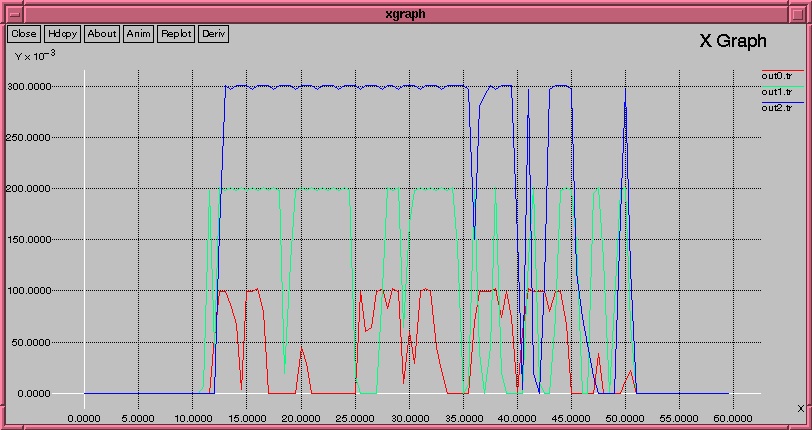
- .tr file is actual file helpful to see the performance factors like (throughput, packet drop, etc.). You can parse the .tr file using software’s like tracegraph202 or Xgraph
Nam
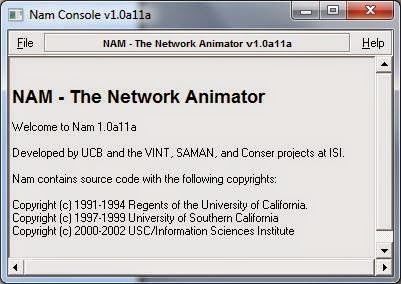
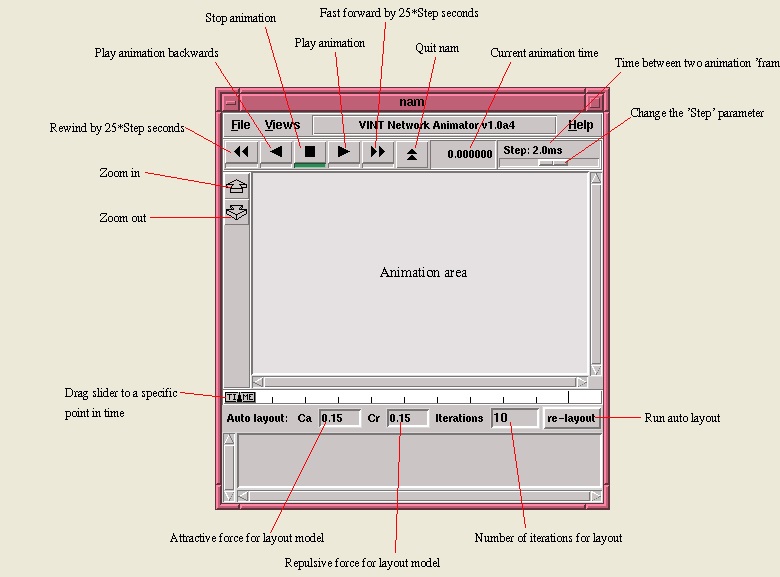
Nam is a Tcl/TK based animation tool for viewing network simulation traces and real world packet trace data. The design theory behind nam was to create an animator that is able to read large animation data sets and be extensible enough so that it could be used in different network visualization situations. Under this constraint, nam was designed to read simple animation event commands from a large trace file. In order to handle large animation data sets a minimum amount of information is kept in memory. Event commands are kept in the file and reread from the file whenever necessary. The first step to use nam is to produce the trace file. The trace file contains topology information, e.g., nodes, links, as well as packet traces. Usually, the trace file is generated by NS. During an ns simulation, user can produce topology configurations, layout information, and packet traces using tracing events in NS. However any application can generate a nam trace file. When the trace file is generated, it is ready to be animated by nam. Upon startup, nam will read the trace file, create topology, pop up a window, do the layout if necessary, and then pause at time 0. Through its user interface, nam provides control over many aspects of animation. These functionalities will be described in detail in the USER INTERFACE section. After compiling tcl script file, nam console and nam window as shown in the figures will be automatically opened.


Xgraph
The Xgraph program draws a graph on an X display given data read from either data files or from standard input if no files are specified. It can display up to 64 independent data sets using different colors and/or line styles for each set. It annotates the graph with a title, axis labels, grid lines or tick marks, grid labels, and a legend. There are options to control the appearance of most components of the graph. A data set consists of an ordered list of points for the “directive X Y”. For directive “draw”, a line will be drawn between the previous point and the current point. “Draw” is the default directive. The name of a dataset can be specified by enclosing the name in double quotes. Overall graphing options for the graph can be specified in data files by writing lines of the form “

Main NS2 Simulation Steps
The followings show the three key step guideline in defining a simulation scenario in an NS2:
Step 1: Simulation Design
The first step in simulating a network is to design the simulation. In this step, the users should determine the simulation purposes, network configuration and assumptions, the performance measures, and the type of expected results.
Step 2: Configuring and Running Simulation
This step implements the design in the first step. It consists of two phases:
- Network configuration phase: In this phase network components (e.g., node, TCP and UDP) are created and configured according to the simulation design. Also, the events such as data transfer are scheduled to start at a certain time.
- Simulation Phase: This phase starts the simulation which was configured in the Network Configuration Phase. It maintains the simulation clock and executes events chronologically. This phase usually runs until the simulation clock reached a threshold value specified in the Network Configuration Phase. In most cases, it is convenient to define a simulation scenario in a Tcl scripting file (e.g.,
Step 3: Post Simulation Processing
The main tasks in these steps include verifying the integrity of the program and evaluating the performance of the simulated network. While the first task is referred to as debugging, the second one is achieved by properly collecting and compiling simulation results
This article is taken from my old blog.