Scikit-learn (formerly scikits.learn) is a free software machine learning library for the Python programming language. It features various classification, regression and clustering algorithms including support vector machines, random forests, gradient boosting, k-means and DBSCAN, and is designed to interoperate with the Python numerical and scientific libraries NumPy and SciPy. To learn more about downloading and installing scikit, visit official website.
Understanding Linear Regression
Linear regression allows us to find the relationship between dependent variable denoted as Y and one or more independent variables X. Let's understand simplest form of the regression equation with one dependent and one independent variable.
In algebra, the points which are (x,y) pairs can be plotted on the Cartesian coordinate system and also a straight line on the Cartesian coordinate system has the equation y = mx + b, where m is the slope of the line, and b is the y-intercept of the line. In other terms y = estimated dependent variable , m is the feature weights, b = bias term, and x = score on the independent variable.
Let's rewrite the equation for more than one independent variables
y = m1x1 +m2x2+ m3x3 + ....... + mixi + b
where
- n is the number of features
- xi is the ith feature
- mi is the ith model parameter
Implementation
In our first attempt to learn ML algorithms using scikit, we will implement Linear Regression to predict prices of stocks. In this example we will use apple stock prices for 1 year which can be downloaded from here. You can try with any other stock which is available at nasdaq.
Let's get started.
Firstly, we will import the required libraries which includes: Scikit, Numpy, Pandas and Matplotlib.
Now, lets see the steps for preparing the dataset for Linear Regression model training.
Firstly, we import the stock dataset file using pandas library method pd.read_csv to pandas dataframe.
Second, converting the date into numeric value using time and date python library. We can also convert date into different columns like day,month and year
but for our simplicity of one feature let's just convert into numeric value.
The third one is to convert the pandas dateframe into numpy array using np.array(). The linear model of scikit accepts only numpy array.
The last one is to reshape the numpy arrays to n X 1 shape. The reshape() method will reshape the features so that it will be feed to scikit library.
We will now divide the dataset into two parts for training and testing. Scikit provides train_test_split(*arrays, **options) to split the dataset.
By default, test_size value is set to 0.25 and train_size value is set to 0.75. We can change these values according to our needs.
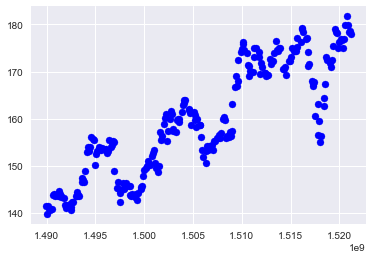
Our next step is to visualize the dataset for data insights. Although our dataset is a simple one, it is a good practise to visualize the data.Using Matplotlib we can plot the graph
Linear Regression implementation is pretty straight forward in scikit. Two lines of code is all that is required. First line will fit the the training data into the linear regression model. The second line is to use the trained model to predict.Now we have a trained Linear Regression model. We are now able to make predictions on unseen data
How would we know whether our model is good enough? For that we calculate coefficient of determination.
R2 is a statistic that will give some information about the goodness of fit of a model.
In regression, the R2 coefficient of determination is a statistical measure of how well the regression line approximates the real data points.
An R2 of 1 indicates that the regression line perfectly fits the data.. linear_model_.score(X, y) gives us the score.
Our training data score is 0.785 and testing data score is 0.787. Training and testing scores will give us information about model overfitting and underfitting.
If the model performs well during training (training score) and underperforms during testing (testing score) then the model is overfiting. If the model doesn't perform
well during training or testing then the model is underfitting. Our model is performing decently well.
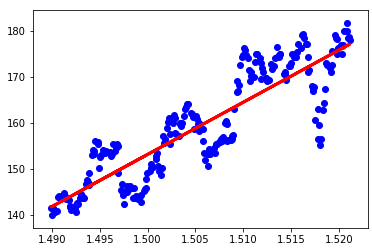
Now, let's plot the trained Linear Regression model. The plot below also showing the prices of apple stock and the learned regression line.
Before concluding let's predict the price of the apple stock on a given day.
I hope you liked this tutorial. You can find the complete code on my github StockPrediction. If you want to learn more about maths behind Linear Regression or ML in general, do check the following resources:
- Linear Regression on Khan Academy
- Machine learning course on Coursera by Andrew Ng
- Introduction to Linear Regression Analysis by Douglas Montgomery, Elizabeth A. Peck, and G. Geoffrey Vining
If you have any question or feedback, please do reach out to me by commenting below.